Postprocess convective ABL case
%%capture
import sys, os, shutil
postproamrwinddir = '~/src/amr-wind-frontend/'
if postproamrwinddir not in sys.path:
    sys.path.append(postproamrwinddir)
# Load the libraries
import matplotlib.pyplot as plt
import postproamrwindabl as ppabl
import numpy             as np
from matplotlib import cm
import re
import time
import pandas as pd
import xarray as xr

# Also ignore warnings
import warnings
warnings.filterwarnings('ignore')

# Make all plots inline
%matplotlib inline
def plotrotorlines(zhh, rotorD,**kwargs):
    plt.axhline(zhh,             linewidth=1.0, **kwargs) # Plot the HH line
    plt.axhline(zhh+rotorD*0.5,  linewidth=0.5, **kwargs) # Plot the HH line
    plt.axhline(zhh-rotorD*0.5,  linewidth=0.5, **kwargs) # Plot the HH line

def savecsvdata(d, savekeys, filename):
    # Create a new dictionary
    dfcsv = pd.DataFrame()
    for newkey,oldkey in savekeys.items():
        dfcsv[newkey] = d[oldkey]
    dfcsv.to_csv(filename,index=False,sep=',')
    return

def plot_profile(var,df,avgt):
    returndict = {}
    temp_dict = {}
    prof = ppabl.CalculatedProfile.fromdict(ppabl.statsprofiles[var],df,temp_dict,avgt=avgt)
    z, plotdat = prof.calculate()
    returndict[ppabl.statsprofiles[var]['header']] = {'z':z, 'data':plotdat}
    return returndict
rundir='/gpfs/lcheung/HFM/exawind-benchmarks/convective_abl/'
resultsdir='../results/'
casenames = [
    'AMR-Wind, t=[15000,20000]'
]
caseparams = {}
caseparams[casenames[0]] = {'rundir':rundir, 'saveprefix':'avgprofile_5000s','ncfile':'post_processing/abl_statistics30000.nc', 'avgtimes':[15000,20000],'lstyle':{'color':'tab:blue',}}

# Hub-height locations
zHH_target    = 90.0
rotorD        = 126
bottom_tip    = zHH_target - 0.5*rotorD
top_tip       = zHH_target + 0.5*rotorD

plotheights=[bottom_tip,zHH_target,top_tip]

loadinmemory = False   # Do this only if there's enough RAM and for new (python 3+ netCDF4) libraries
dfs = {}
for case in casenames:
    print("Case: ",case)
    file = caseparams[case]['rundir'] + '/' + caseparams[case]['ncfile']
    df = ppabl.loadnetcdffile(caseparams[case]['rundir']+'/'+caseparams[case]['ncfile'], usemmap=loadinmemory)
    report = ppabl.printReport(df,avgt=caseparams[case]['avgtimes'], heights=plotheights,span=(bottom_tip,top_tip))
    dfs[case] = {}
    dfs[case]['df'] = df
    dfs[case]['report'] = report
Case:  AMR-Wind, t=[15000,20000]
Loading v
Loading u
Loading w'theta'_r
Loading theta
Loading u'u'_r
Loading w'w'_r
Loading v'v'_r
        z       Uhoriz      WindDir       TI_TKE     TI_horiz        Alpha    Alpha-Fit     ObukhovL         Veer     Veer-Fit
      ===         ====         ====         ====         ====         ====         ====         ====         ====         ====
    27.00 9.898237e+00 2.397437e+02 8.294232e-02 1.396770e-01 1.299356e-01 9.446530e-02 -2.447446e+03 8.765632e-03 1.515664e-03
    90.00 1.139983e+01 2.400028e+02 6.173801e-02 9.830029e-02 8.154171e-02 9.446530e-02 -2.017924e+03 6.082818e-04 1.515664e-03
   153.00 1.189863e+01 2.400229e+02 5.387763e-02 8.458292e-02 6.932999e-02 9.446530e-02 -2.341192e+03 1.245154e-04 1.515664e-03

ustar: 0.468587
zi: 803.132957
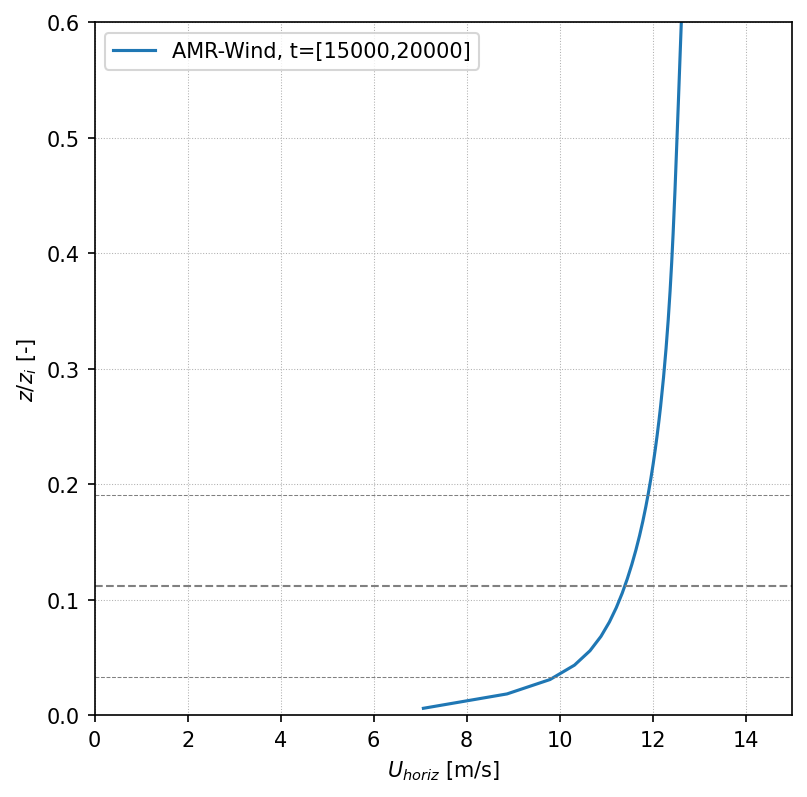
Plot velocity profile
# Plot velocity
var='Uhoriz'
fig, ax = plt.subplots(figsize=(6,6), facecolor='w', dpi=150)
for case in casenames:
    df = dfs[case]['df']
    report = dfs[case]['report']
    amrdat = plot_profile(var,df,caseparams[case]['avgtimes'])
    lstyle=caseparams[case]['lstyle']
    plt.plot(amrdat[var]['data'], amrdat[var]['z']/report['zi'], label=case,**lstyle)
    if 'saveprefix' in caseparams[case]:
        savecsvdata(amrdat[var], {'z':'z', var:'data'}, resultsdir+caseparams[case]['saveprefix']+'_'+var+'.csv')


# Plot the turbine dimensions
plotrotorlines(zHH_target/report['zi'], rotorD/report['zi'], ls='--', color='gray',)

ax.legend()
ax.set_xlim([0, 15])
ax.set_ylim([0, 0.6])
ax.set_xlabel('$U_{horiz}$ [m/s]')
ax.grid(linestyle=':', linewidth=0.5)
ax.set_ylabel('$z/z_i$ [-]')
plt.savefig("./figures/AVG_horiz_profiles_Uhoriz.png")
Loading u
Loading v
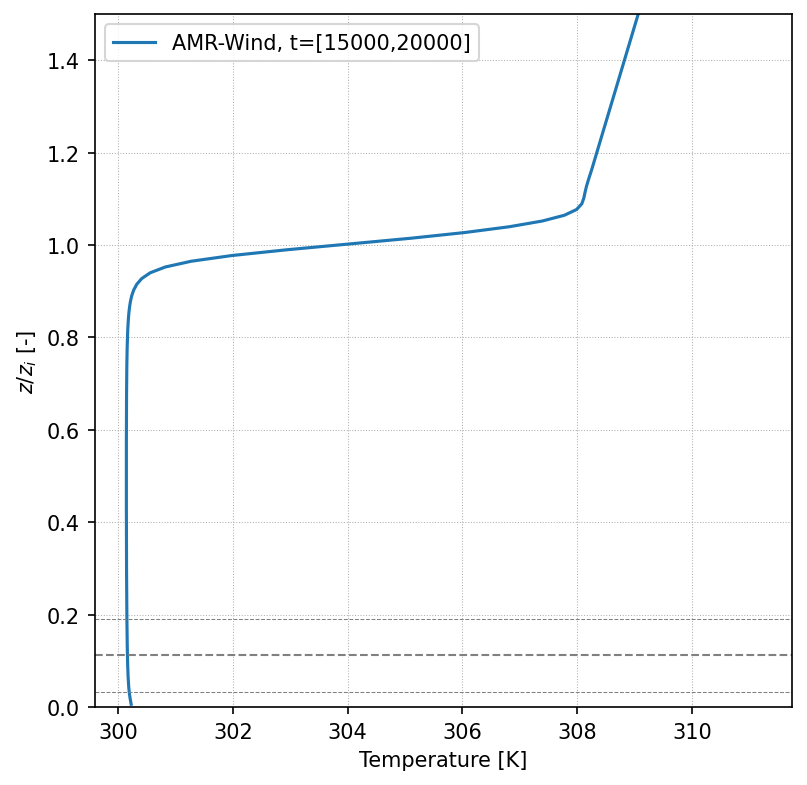
Plot temperature profiles
var = ('Temperature','T')
fig, ax = plt.subplots(figsize=(6,6), facecolor='w', dpi=150)
for case in casenames:
    df = dfs[case]['df']
    report = dfs[case]['report']
    amrdat = plot_profile(var[0],df,caseparams[case]['avgtimes'])
    lstyle=caseparams[case]['lstyle']
    plt.plot(amrdat[var[1]]['data'], amrdat[var[1]]['z']/report['zi'], label=case,**lstyle)
    if 'saveprefix' in caseparams[case]:
        savecsvdata(amrdat[var[1]], {'z':'z', var[1]:'data'}, resultsdir+caseparams[case]['saveprefix']+'_'+var[1]+'.csv')

# Plot the turbine dimensions
plotrotorlines(zHH_target/report['zi'], rotorD/report['zi'], ls='--', color='gray',)


ax.legend()
#ax.set_xlim([290, 294])
ax.set_ylim([0, 1.5])
ax.set_xlabel(var[0] + ' [K]')
ax.grid(linestyle=':', linewidth=0.5)
ax.set_ylabel('$z/z_i$ [-]')
plt.savefig("./figures/AVG_horiz_profiles_T.png")
Loading theta
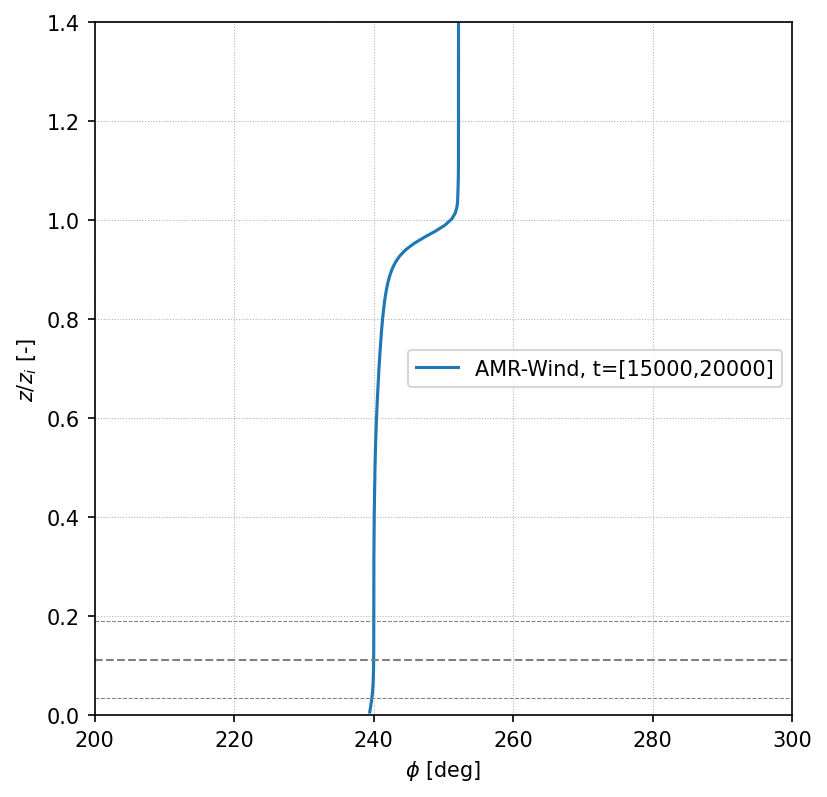
Plot veer profile
var='WindDir'
fig, ax = plt.subplots(figsize=(6,6), facecolor='w', dpi=150)
for case in casenames:
    df = dfs[case]['df']
    report = dfs[case]['report']
    amrdat = plot_profile(var,df,caseparams[case]['avgtimes'])
    lstyle=caseparams[case]['lstyle']
    plt.plot(amrdat[var]['data'], amrdat[var]['z']/report['zi'], label=case,**lstyle)
    if 'saveprefix' in caseparams[case]:
        savecsvdata(amrdat[var], {'z':'z', var:'data'}, resultsdir+caseparams[case]['saveprefix']+'_'+var+'.csv')

# Plot the turbine dimensions
plotrotorlines(zHH_target/report['zi'], rotorD/report['zi'], ls='--', color='gray',)

ax.legend()
ax.set_xlim([200, 300])
ax.set_ylim([0, 1.4])
ax.set_xlabel('$\phi$ [deg]')
ax.grid(linestyle=':', linewidth=0.5)
ax.set_ylabel('$z/z_i$ [-]')
plt.savefig("./figures/AVG_horiz_profiles_WindDir.png")
Loading u
Loading v
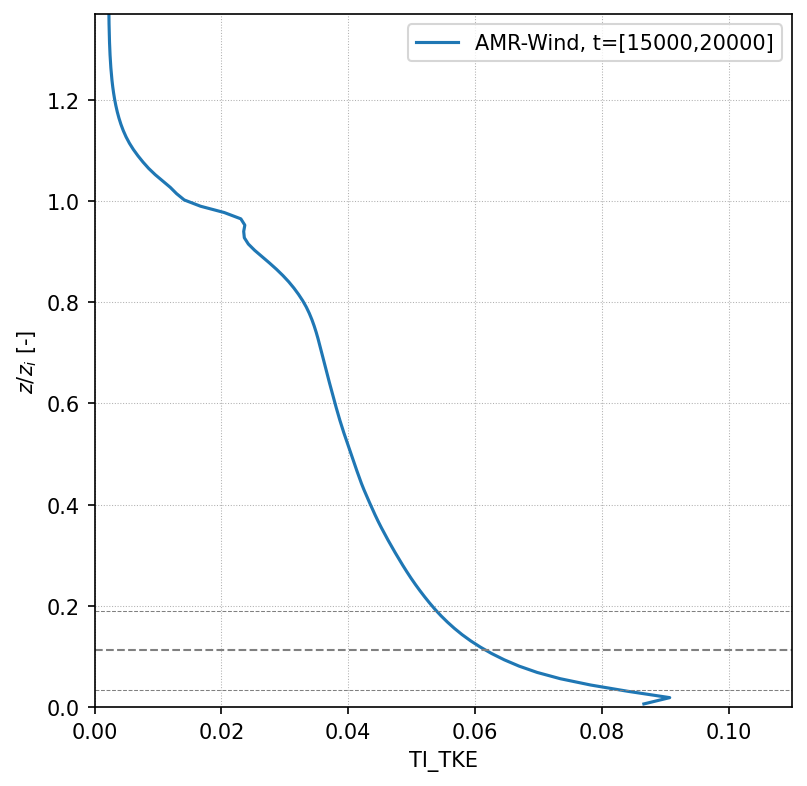
Plot TI
fig, ax = plt.subplots(figsize=(6,6), facecolor='w', dpi=150)
var = 'TI_TKE'
for case in casenames:
    df = dfs[case]['df']
    report = dfs[case]['report']
    amrdat = plot_profile(var,df,caseparams[case]['avgtimes'])
    lstyle=caseparams[case]['lstyle']
    plt.plot(amrdat[var]['data'], amrdat[var]['z']/report['zi'], label=case,**lstyle)
    if 'saveprefix' in caseparams[case]:
        savecsvdata(amrdat[var], {'z':'z', var:'data'}, resultsdir+caseparams[case]['saveprefix']+'_'+var+'.csv')

# Plot the turbine dimensions
plotrotorlines(zHH_target/report['zi'], rotorD/report['zi'], ls='--', color='gray',)


ax.legend()
plt.ylim([0, 1100/report['zi']])
plt.xlim([0, .11])
ax.set_xlabel('TI_TKE')
ax.grid(linestyle=':', linewidth=0.5)
ax.set_ylabel('$z/z_i$ [-]')
plt.savefig("./figures/AVG_horiz_profiles_TI.png")
Loading u
Loading v
Loading u'u'_r
Loading v'v'_r
Loading w'w'_r
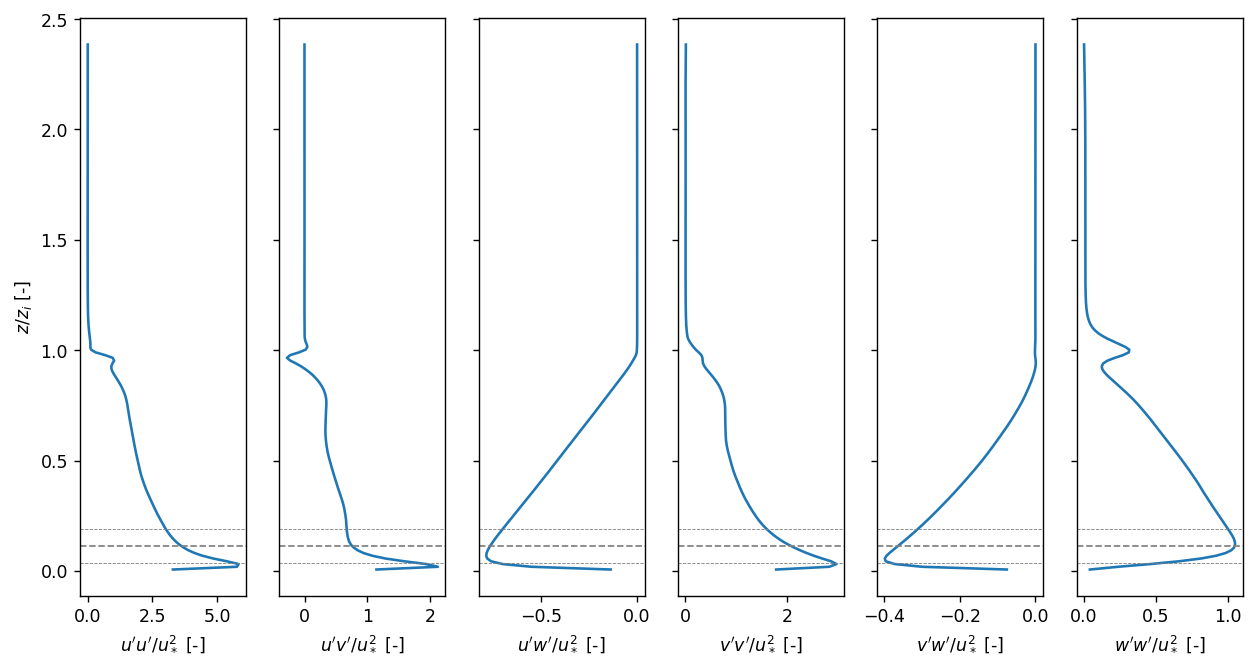
Plot Reynolds stresses
var = 'ReStresses'
fig, axs = plt.subplots(1, 6,figsize=(12,6), facecolor='w', dpi=125, sharey=True)
plotlabels = ['$u\'u\'$', '$u\'v\'$', '$u\'w\'$','$v\'v\'$','$v\'w\'$','$w\'w\'$']
plotvars = ['uu', 'uv', 'uw', 'vv', 'vw', 'ww']
for case in casenames:
    df = dfs[case]['df']
    report = dfs[case]['report']
    amrdat = plot_profile(var,df,caseparams[case]['avgtimes'])
    for i , v in enumerate(plotvars):
        ax = axs[i]
        amrdat[v] = {}
        plt.sca(ax)
        amrdat[v]['data'] = amrdat['uu uv uw vv vw ww']['data'][:,i]
        amrdat[v]['z']    = amrdat['uu uv uw vv vw ww']['z']
        re = amrdat[v]['data']
        ustar = report['ustar']
        z = amrdat[v]['z']
        lstyle=caseparams[case]['lstyle']
        plt.plot(re/ustar**2, z/report['zi'],**lstyle)
        ax.set_xlabel(plotlabels[i] + '$/u_*^2$ [-]')
        if 'saveprefix' in caseparams[case]:
            savecsvdata(amrdat[v], {'z':'z', v:'data'}, resultsdir+caseparams[case]['saveprefix']+'_'+v+'.csv')
        # Plot the turbine dimensions
        plotrotorlines(zHH_target/report['zi'], rotorD/report['zi'], ls='--', color='gray',)

axs[0].set_ylabel('$z/z_i$ [-]')
plt.savefig("./figures/AVG_horiz_profiles_RE.png")
Loading u'u'_r
Loading u'v'_r
Loading u'w'_r
Loading v'v'_r
Loading v'w'_r
Loading w'w'_r
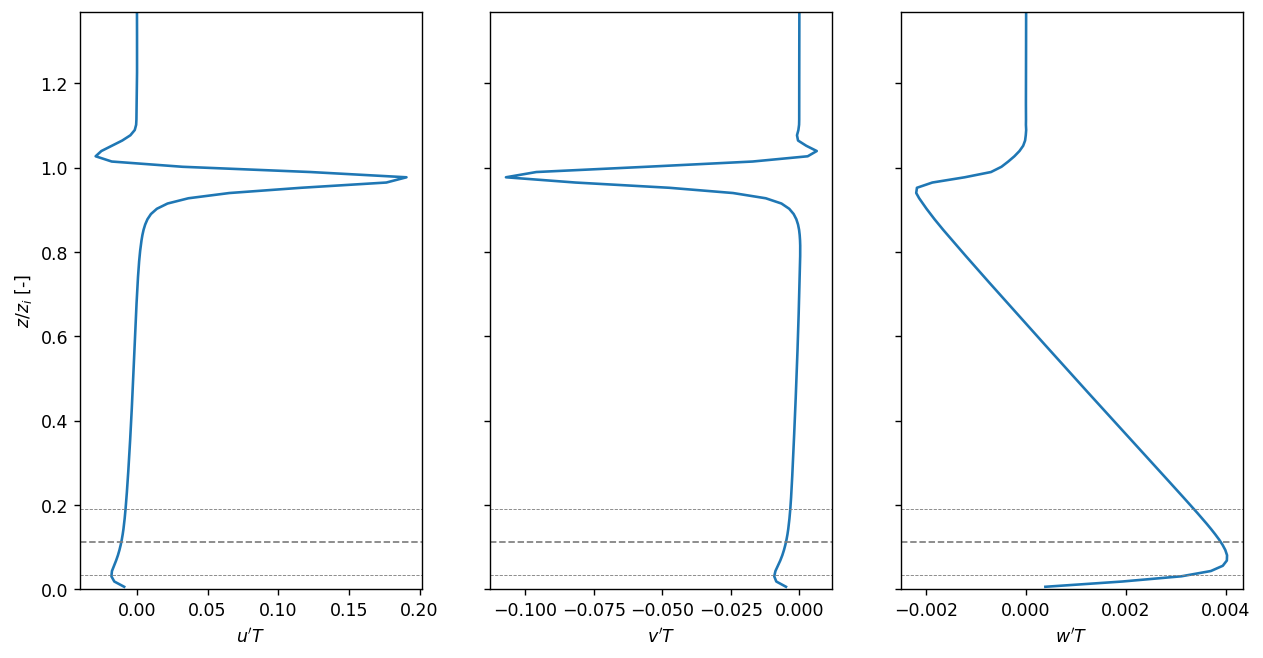
Plot temperature fluxes
var = 'Tfluxes'
#fig, ax = plt.subplots(figsize=(6,6), facecolor='w', dpi=150)
fig, axs = plt.subplots(1, 3,figsize=(12,6), facecolor='w', dpi=125, sharey=True)
plotlabels = ['$u\'T$', '$v\'T$', '$w\'T$',]
plotvars = ['uT','vT','wT']
for case in casenames:
    df = dfs[case]['df']
    report = dfs[case]['report']
    amrdat = plot_profile(var,df,caseparams[case]['avgtimes'])
    for i, v in enumerate(plotvars):
        ax = axs[i]
        plt.sca(ax)
        amrdat[v] = {}
        amrdat[v]['data'] = amrdat['uT vT wT']['data'][:,i]
        amrdat[v]['z']    = amrdat['uT vT wT']['z']
        ustar = report['ustar']
        z = amrdat[v]['z']
        data = amrdat[v]['data']
        lstyle=caseparams[case]['lstyle']
        plt.plot(data, z/report['zi'],**lstyle)
        ax.set_xlabel(plotlabels[i])
        plt.ylim([0, 1100/report['zi']])
        if 'saveprefix' in caseparams[case]:
            savecsvdata(amrdat[v], {'z':'z', v:'data'}, resultsdir+caseparams[case]['saveprefix']+'_'+v+'.csv')
        # Plot the turbine dimensions
        plotrotorlines(zHH_target/report['zi'], rotorD/report['zi'], ls='--', color='gray',)

axs[0].set_ylabel('$z/z_i$ [-]')
plt.savefig("./figures/AVG_horiz_profiles_uT.png")
Loading u'theta'_r
Loading v'theta'_r
Loading w'theta'_r