yamlstring="""
globalattributes:
verbose: False
executeorder:
- linesampler
- plotcsv
linesampler:
- name: metmast_1k
ncfile:
- /gpfs/lcheung/HFM/exawind-benchmarks/convective_abl/post_processing/metmast_30000.nc
group: virtualmast
varnames: ['velocityx', 'velocityy', 'velocityz', 'temperature']
average:
tavg: [15000, 16000]
savefile: ../results/avgmast_1000.csv
- name: metmast_120
ncfile:
- /gpfs/lcheung/HFM/exawind-benchmarks/convective_abl/post_processing/metmast_30000.nc
group: virtualmast
varnames: ['velocityx', 'velocityy', 'velocityz', 'temperature']
average:
tavg: [15000, 15120]
savefile: ../results/avgmast_0120.csv
- name: metmast_600
ncfile:
- /gpfs/lcheung/HFM/exawind-benchmarks/convective_abl/post_processing/metmast_30000.nc
group: virtualmast
varnames: ['velocityx', 'velocityy', 'velocityz', 'temperature']
average:
tavg: [15000, 15600]
savefile: ../results/avgmast_0600.csv
plotcsv:
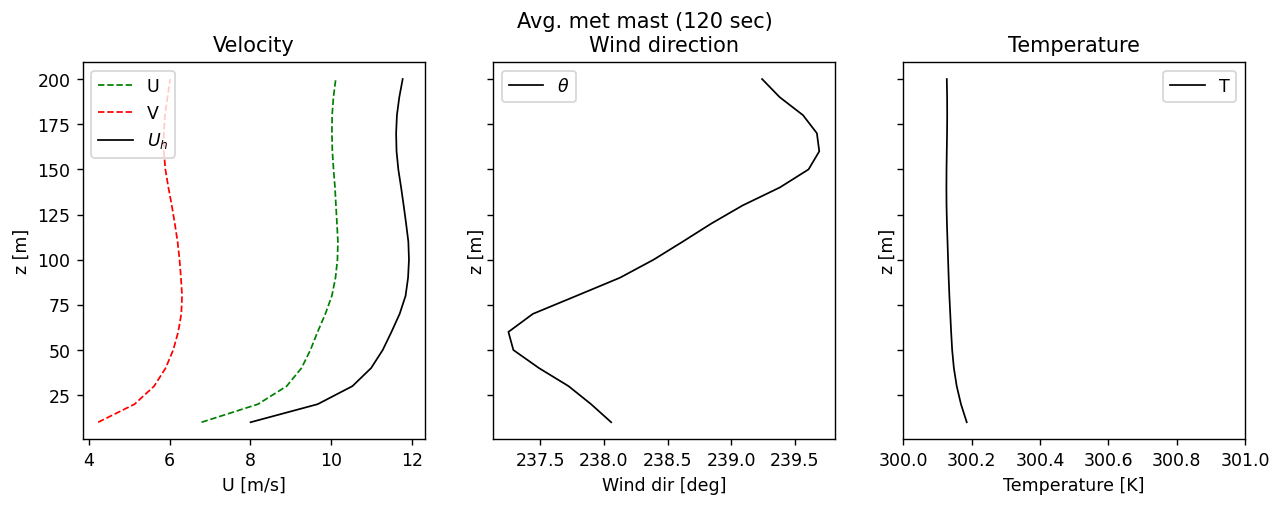
# Averaged over 120 seconds
- name: plotUh
xlabel: 'U [m/s]'
ylabel: 'z [m]'
title: 'Velocity'
figsize: [5,4]
legendopts: {'loc':'upper left'}
figname: avg0120
axesnum: 0
#postplotfunc: plothelper.formatplot
csvfiles:
- {'file':'../results/avgmast_0120.csv', 'ycol':'z', 'xcol':'velocityx_avg', 'lineopts':{'color':'g', 'lw':1, 'linestyle':'--', 'label':'U'}}
- {'file':'../results/avgmast_0120.csv', 'ycol':'z', 'xcol':'velocityy_avg', 'lineopts':{'color':'r', 'lw':1, 'linestyle':'--', 'label':'V'}}
- {'file':'../results/avgmast_0120.csv', 'ycol':'z', 'xcol':'', 'xscalefunc':'lambda x:np.array(np.sqrt(x["velocityx_avg"]**2+x["velocityy_avg"]**2))', 'lineopts':{'color':'k', 'lw':1, 'linestyle':'-', 'label':'$U_h$'}}
- name: plotWindDir
xlabel: 'Wind dir [deg]'
ylabel: 'z [m]'
title: 'Wind direction'
figsize: [5,4]
legendopts: {'loc':'upper left'}
figname: avg0120
axesnum: 1
#postplotfunc: plothelper.formatplot
csvfiles:
- {'file':'../results/avgmast_0120.csv', 'ycol':'z', 'xcol':'', 'xscalefunc':'lambda x:np.array(270-np.arctan2(x["velocityy_avg"], x["velocityx_avg"])*180.0/np.pi)',
'lineopts':{'color':'k', 'lw':1, 'linestyle':'-', 'label':'$\\theta$'}}
- name: plotT
xlabel: 'Temperature [K]'
ylabel: 'z [m]'
title: 'Temperature'
figsize: [5,4]
legendopts: {'loc':'upper right'}
figname: avg0120
axesnum: 2
postplotfunc: postproengine.formatTfig
csvfiles:
- {'file':'../results/avgmast_0120.csv', 'ycol':'z', 'xcol':'temperature_avg', 'lineopts':{'color':'k', 'lw':1, 'linestyle':'-', 'label':'T'}}
savefile: ../results/avgmetmast_0120.png
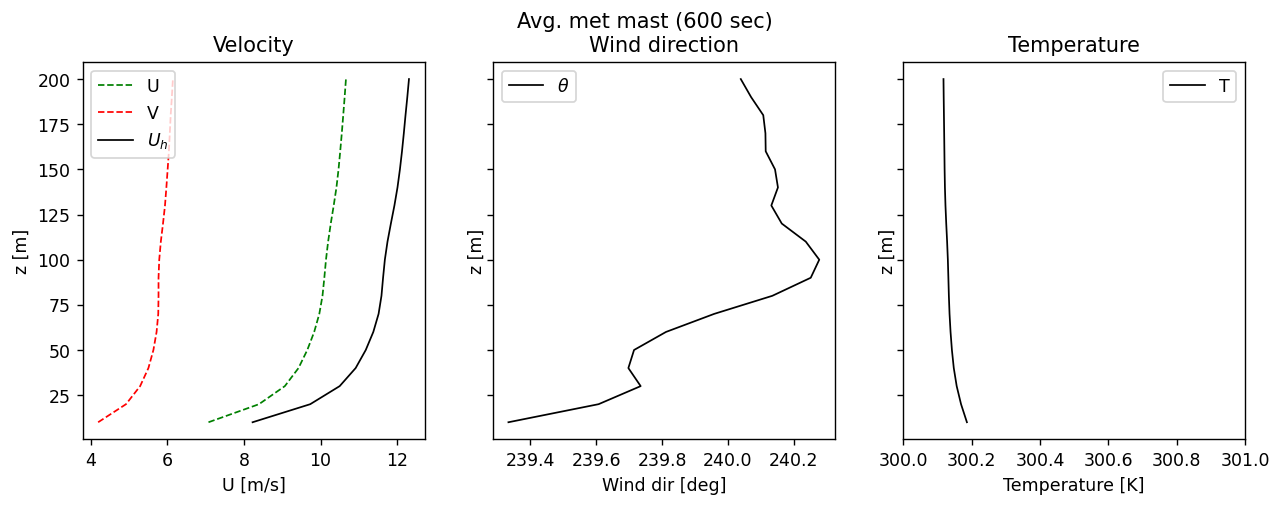
# Averaged over 600 seconds
- name: plotUh
xlabel: 'U [m/s]'
ylabel: 'z [m]'
title: 'Velocity'
figsize: [5,4]
legendopts: {'loc':'upper left'}
figname: avg0600
axesnum: 0
#postplotfunc: plothelper.formatplot
csvfiles:
- {'file':'../results/avgmast_0600.csv', 'ycol':'z', 'xcol':'velocityx_avg', 'lineopts':{'color':'g', 'lw':1, 'linestyle':'--', 'label':'U'}}
- {'file':'../results/avgmast_0600.csv', 'ycol':'z', 'xcol':'velocityy_avg', 'lineopts':{'color':'r', 'lw':1, 'linestyle':'--', 'label':'V'}}
- {'file':'../results/avgmast_0600.csv', 'ycol':'z', 'xcol':'', 'xscalefunc':'lambda x:np.array(np.sqrt(x["velocityx_avg"]**2+x["velocityy_avg"]**2))', 'lineopts':{'color':'k', 'lw':1, 'linestyle':'-', 'label':'$U_h$'}}
- name: plotWindDir
xlabel: 'Wind dir [deg]'
ylabel: 'z [m]'
title: 'Wind direction'
figsize: [5,4]
legendopts: {'loc':'upper left'}
figname: avg0600
axesnum: 1
#postplotfunc: plothelper.formatplot
csvfiles:
- {'file':'../results/avgmast_0600.csv', 'ycol':'z', 'xcol':'', 'xscalefunc':'lambda x:np.array(270-np.arctan2(x["velocityy_avg"], x["velocityx_avg"])*180.0/np.pi)',
'lineopts':{'color':'k', 'lw':1, 'linestyle':'-', 'label':'$\\theta$'}}
- name: plotT
xlabel: 'Temperature [K]'
ylabel: 'z [m]'
title: 'Temperature'
figsize: [5,4]
legendopts: {'loc':'upper right'}
figname: avg0600
axesnum: 2
postplotfunc: postproengine.formatTfig
csvfiles:
- {'file':'../results/avgmast_0600.csv', 'ycol':'z', 'xcol':'temperature_avg', 'lineopts':{'color':'k', 'lw':1, 'linestyle':'-', 'label':'T'}}
savefile: ../results/avgmetmast_0600.png
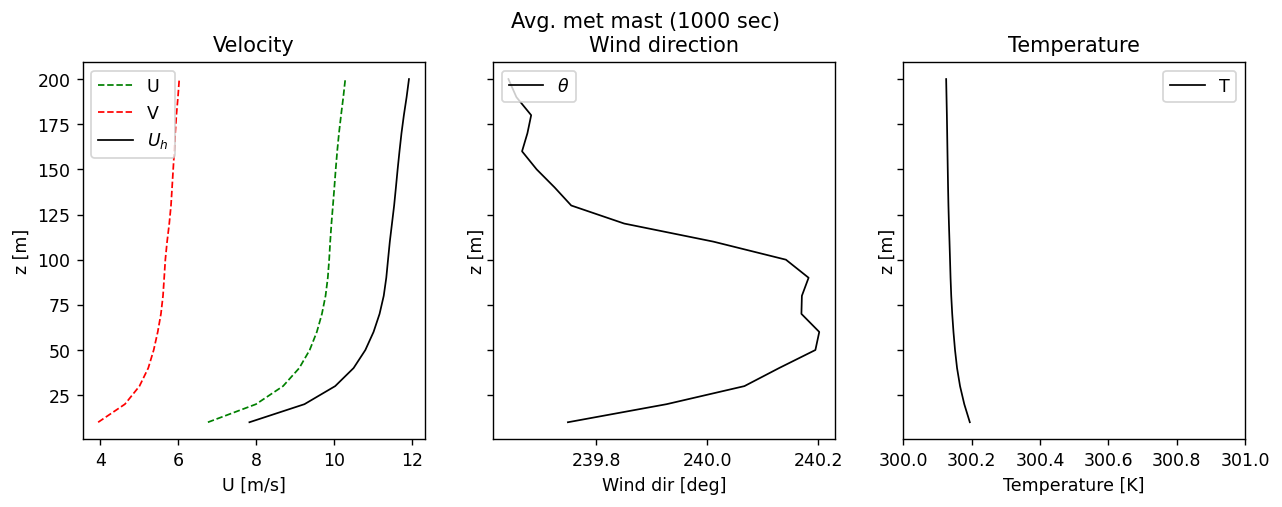
# Averaged over 1000 seconds
- name: plotUh
xlabel: 'U [m/s]'
ylabel: 'z [m]'
title: 'Velocity'
figsize: [5,4]
legendopts: {'loc':'upper left'}
figname: avg1000
axesnum: 0
#postplotfunc: plothelper.formatplot
csvfiles:
- {'file':'../results/avgmast_1000.csv', 'ycol':'z', 'xcol':'velocityx_avg', 'lineopts':{'color':'g', 'lw':1, 'linestyle':'--', 'label':'U'}}
- {'file':'../results/avgmast_1000.csv', 'ycol':'z', 'xcol':'velocityy_avg', 'lineopts':{'color':'r', 'lw':1, 'linestyle':'--', 'label':'V'}}
- {'file':'../results/avgmast_1000.csv', 'ycol':'z', 'xcol':'', 'xscalefunc':'lambda x:np.array(np.sqrt(x["velocityx_avg"]**2+x["velocityy_avg"]**2))', 'lineopts':{'color':'k', 'lw':1, 'linestyle':'-', 'label':'$U_h$'}}
- name: plotWindDir
xlabel: 'Wind dir [deg]'
ylabel: 'z [m]'
title: 'Wind direction'
figsize: [5,4]
legendopts: {'loc':'upper left'}
figname: avg1000
axesnum: 1
#postplotfunc: plothelper.formatplot
csvfiles:
- {'file':'../results/avgmast_1000.csv', 'ycol':'z', 'xcol':'', 'xscalefunc':'lambda x:np.array(270-np.arctan2(x["velocityy_avg"], x["velocityx_avg"])*180.0/np.pi)',
'lineopts':{'color':'k', 'lw':1, 'linestyle':'-', 'label':'$\\theta$'}}
- name: plotT
xlabel: 'Temperature [K]'
ylabel: 'z [m]'
title: 'Temperature'
figsize: [5,4]
legendopts: {'loc':'upper right'}
figname: avg1000
axesnum: 2
postplotfunc: postproengine.formatTfig
csvfiles:
- {'file':'../results/avgmast_1000.csv', 'ycol':'z', 'xcol':'temperature_avg', 'lineopts':{'color':'k', 'lw':1, 'linestyle':'-', 'label':'T'}}
savefile: ../results/avgmetmast_1000.png
"""
f = io.StringIO(yamlstring)
yamldict = Loader(f, **loaderkwargs)